Part A: Strain Gauges:
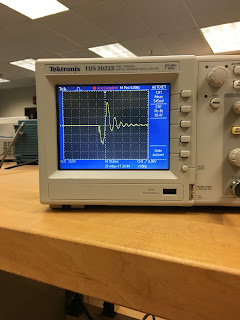
1. Connect the oscilloscope probes to the strain gauge. Record the peak voltage values (positive
and negative) by flipping/tapping the gauge with low and high pressure. Make sure to set the
oscilloscope horizontal and vertical scales appropriately so you can read the values. DO NOT USE
the measure tool of the oscilloscope. Adjust your oscilloscope so you can read the values from
the screen. Fill out Table 1 and provide photos of the oscilloscope.
Flip Strength Data Table
Press Strength Data Table
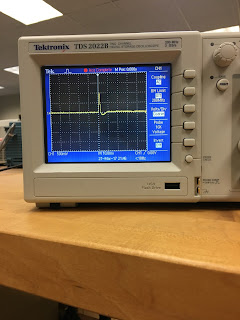
2. Press the “Single” button below the Autoscale button on the oscilloscope. This mode will allow
you to capture a single change at the output. Adjust your time and amplitude scales so you have
the best resolution for your signal when you flip/tap your strain gauge. Provide a photo of the
oscilloscope graph.
 |
| strain gauge oscilloscope graph |
 |
| Graph for button |
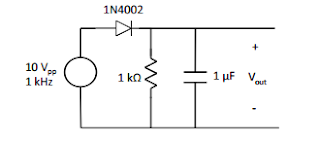
Part B: Half Wave Rectifiers:
1. Construct the following half-wave rectifier. Measure the input and the output using the
oscilloscope and provide a snapshot of the outputs.
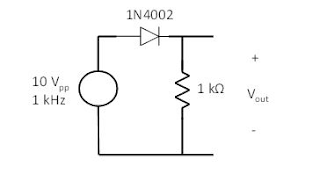 |
| picture of circuit |
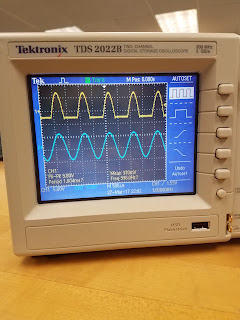 |
| output and input signals for half-wave rectifier |
2. Calculate the effective voltage of the input and output and compare the values with the
measured ones by completing the following table.
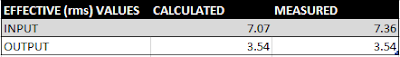 |
| calculated and measured values of half wave rectifier for input and output. |
3. Explain how you calculated the rms values. Do calculated and measured values match?
- For Input the rms values were calculated by dividing the peak to peak value on the function generator by the square root of 2. For output we divide the peak to peak in half then the resultant value by the square root of 2.
4. Construct the following circuit and record the output voltage using both DMM and the
oscilloscope.
 |
| picture of circuit construction |
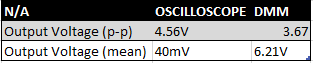 |
| output voltage at capacitor |
5. Replace the 1 µF capacitor with 100 µF and repeat the previous step. What has changed?
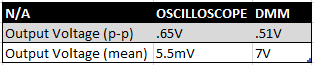 |
output voltage with different capacitor.
|
Part C: Energy Harvesters
1. Construct the half-wave rectifier circuit without the resistor but with the 1 µF capacitor. Instead of the function generator, use the strain gauge. Discharge the capacitor every time you start a new measurement. Flip/tap your strain gauge and observe the output voltage. Fill out the table below:
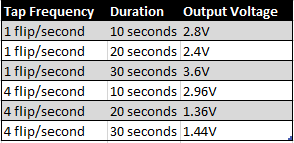 |
| Output voltages for strain gauge, half wave rectifier. |
2. Briefly explain your results.
- The data we acquired from this test was not as accurate as it could've been. We expected the voltage to increase with the amount of time and flips, but due to inconsistency in the flipping we ended up with values that don't exactly follow a constant pace.
3. If we do not use the diode in the circuit (i.e. using only strain gauge to charge the capacitor),
what would you observe at the output? Why?
- The output would be doubled because the diode only allows half the signal to be transmitted.
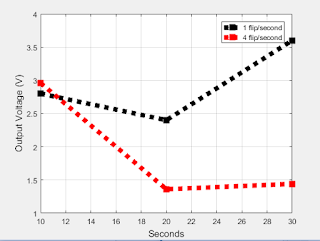
4. Write a MATLAB code to plot the date in table of Part C1.
 |
| Matlab graph for outputs. |


Nice blog this week guys! I noticed that you guys actually achieved less output voltage when doing 4 flips/second. This seems counter intuitive as you would think if you give the capacitor less time to discharge between flips you should achieve a higher overall voltage. This was also the case for us so I wonder why you guys came to a different result.
ReplyDeleteThank you! and yeah, we arent sure why the voltage went down, it really is counterintuitive. im thinking we made a mistake. thanks for the feedback
DeleteFor 1 on part C, our measurements fluctuated as well seeming to follow no apparent pattern, I think it was because once you get to the 4 flips per second, it becomes more important to try and get the 4 in instead of consistency in the strength so the numbers start to fluctuate out of control. Where as with the 1 per second, it was much easier to time the flips and keep the strength consistent.
ReplyDeleteyeah i think consistency had a big role in the stress measuring devices. im also thinking we made a mistake for the 4 flips per sa=econd portion where our voltage went down. thank you for the feedback.
DeleteI noticed your flipping strain gauge achieved much higher voltages than your tapping, our strain gauges were the opposite, I wonder why? Maybe we were flipping and tapping our strain gauges differently than yours.
ReplyDeletei noticed our voltages were also higher than a lot of other groups as well, i wonder if this is from some sort of measuring difference. thank you for the feedback
DeleteNice blog. Our data are not even close to yours. I thought it would be at lease very close as long as we are using the same equipment. For the second question I thought we were supposed to make tables as we did in #1, but I am not sure. Also captions are missing in the last part of the blog.
ReplyDeleteWell done
thanks for the reminder to add captions. do you have any ideas why our data was so different? thanks for the feedback
DeleteIt seems like repeatedly tapping or flicking one of the gauges should raise the output voltage, but my group did not see this result, and apparently your group didn't either. Why do you think this is?
ReplyDeleteim not sure why we had this, it was different than a lot of other groups as well. thanks for the feedback
Delete