Monday, January 30, 2017

Week 4

Monday


1.) 1. (Table and graph) Use the transistor by itself. The goal is to create the graph for IC (y axis) versus VBE (x axis). Connect base and collector. DO NOT EXCEED 1 V for VBE. Make sure you have the required voltage value set before applying it to the base. Transistor might get really hot. Do not TOUCH THE TRANSISTOR! Make sure to get enough data points to graph. (Suggestion: measure for VBE = 0V, 0.5V, and 1V and fill the gaps if necessary by taking extra measurements).

                                                                      Figure 1:  VBE and Ic
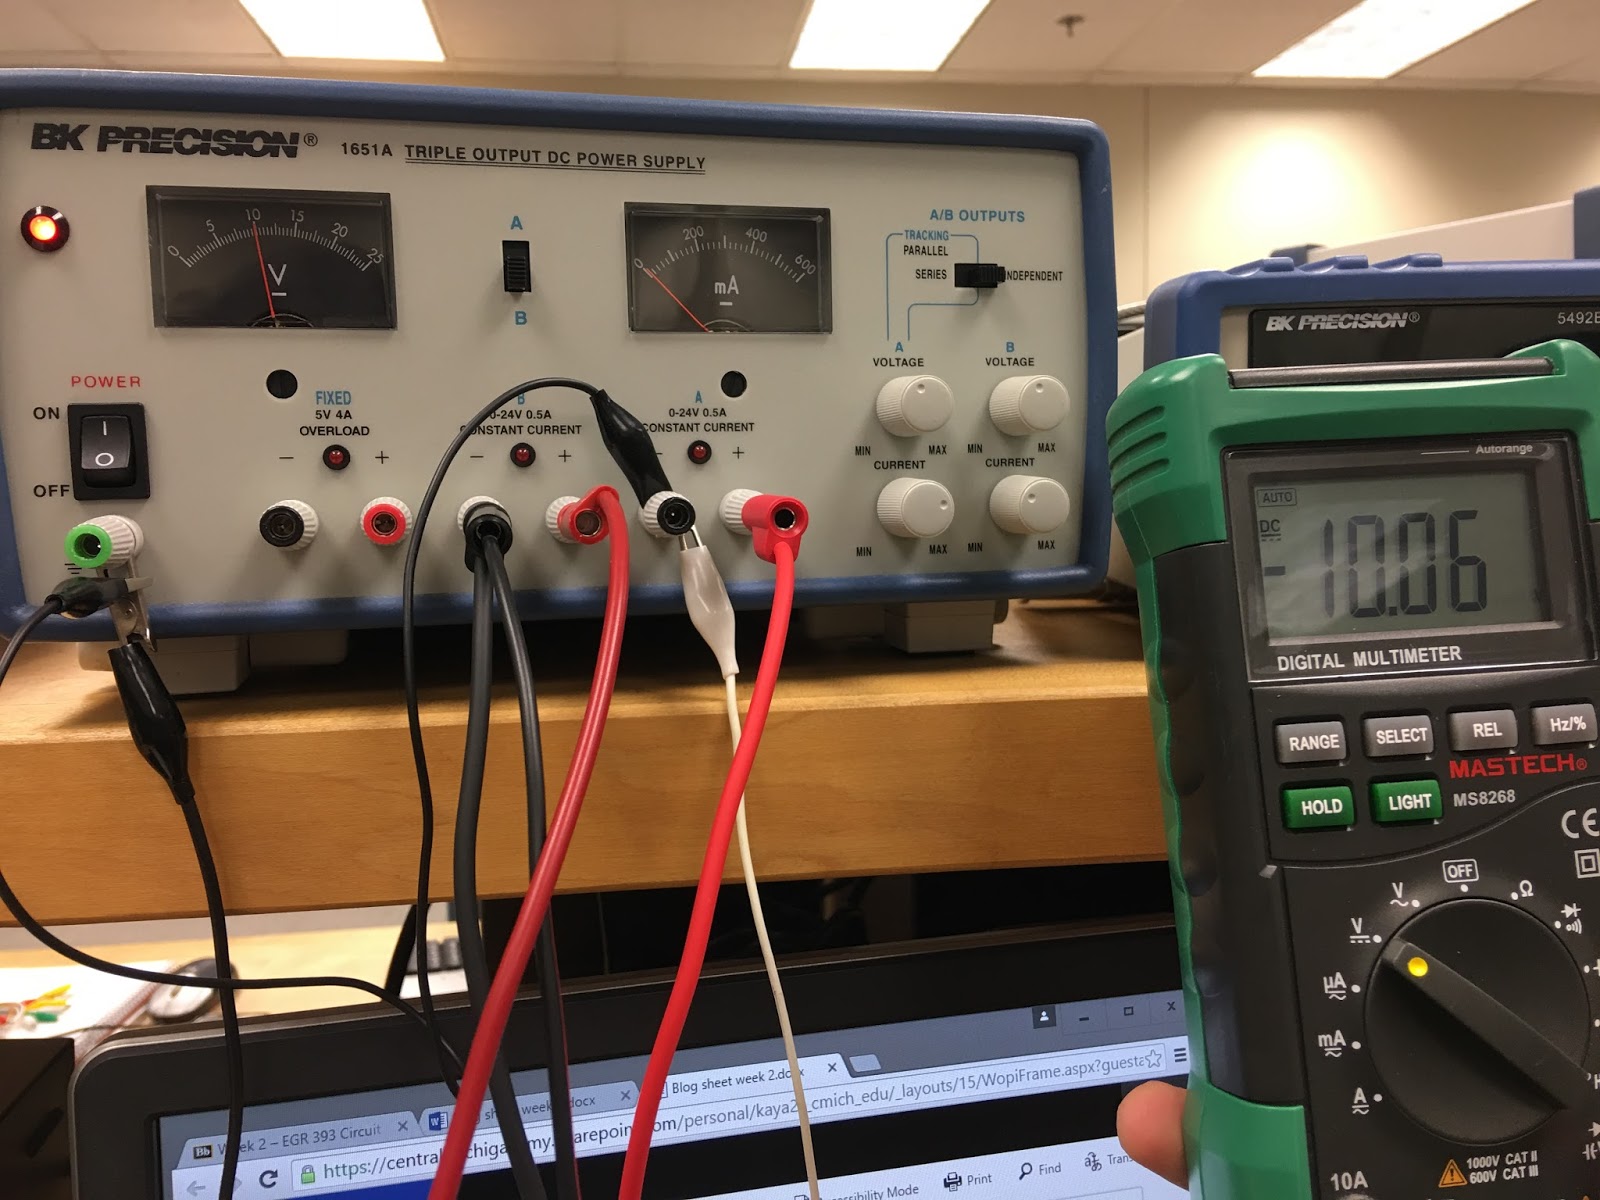
        Figure 2: Voltage vs. Current  
   

  • The circuit presented in Figure 1 of the worksheet was built on the breadboard. We then added different voltage values all of them below one, in order to see the relationship between VBE and IC. The data means that there is a certain voltage (VBE) required before Ic can flow.                                    

2.) (Table and graph) Create the graph for IC (y axis) versus VCE (x axis). Vary VCE from 0 V to 5 V. Do this measurement for 3 different VBE values: 0V, 0.7V, and 0.8V. 


Figure 3: IC vs VCE

Figure 4: Table of data graphed in figure 3.
  • We built a circuit as the one in problem one, this time with two different voltage values. We performed three different trials with different voltage values for each one. We started off with an initial voltage of zero, which gave us 0 current independently from the second voltage added to it. We then bumped the voltage to 0.7, which gave us an increasing current value dependent on the second voltage added. On trial number 3 the results were similar to trial number 2, just a little bit higher since we bumped up the initial voltage from 0.7 to 0.8. The data is interpreted as Ic being dependent on VCE which are both dependent on VBE. 

3.) (Table) Apply the following bias voltages and fill out the table. How is IC and IB related? Does your data support your theory?

Figure 5: Table displaying data of relationship between IC and IB


  • Our theory on the relationship between IC and IB is that they should be always have a constant ratio no matter what the value, this ratio is known as beta. The ratios for the first 2 trials are the same but for the third trial it is not the same. An error could have occurred within our circuit or while measuring to produce this difference.
4.) (Table) Explain photocell outputs with different light settings. Create a table for the light conditions and photocell resistance.

Figure 6: Table showing properties of photocell
  • From the results we acquired from the table above we can clearly see that resistance increases as light decreases, and it decreases when the light is more intense.


5.) (Table) Apply voltage (0 to 5 V with 1 V steps) to DC motor directly and measure the current using the DMM.

Figure 7: Table of voltage applied to motor and current through motor
  • The data in the table displays that as the voltage applied to the motor increases, so does the current.

6.) Apply 2 V to the DC motor and measure the current. Repeat this by increasing the load on the DC motor. Slightly pinching the shaft would do the trick.
  • A voltage of 2.01 was applied to the DC motor the current demanded with no load was 32 mA. As we applied more pressure to the shaft the current kept increasing, maxing out at 150 mA when the motor completely stops.
7.) (Video) Create the circuit below (same circuit from week 1). Explain the operation in detail.


Figure 8: Picture depiction of the circuit created in the video.


Figure 9: Video explaining the circuit.


8.) Explain R4’s role by changing its value to a smaller and bigger resistors and observing the voltage and the current at the collector of the transistor.
  • If R4 was changed to a bigger resistor the speed of the motor will go down. If R4 is changed to a smaller resistor, the speed of the motor will go up.
9.) (Video) Create your own Rube Goldberg setup
Figure 10: A video displaying our Rube Goldberg circuit.

  • Our Rube Goldberg uses the circuit above but with a different motor. It works quite well but still needs some tweaks to work better.

Monday, January 23, 2017

Week 3

Monday


1.) Compare the calculated and measured equivalent resistance values:

Figure 1: The pictures above give a visual representation of the circuit configurations accounted for in  the table below (Figure 2).

Figure 2: The table above shows the calculated and measured resistance values for each resistor along with the difference percentages between measured and calculated values.

2.).Apply 5V on a 120Ω resistor. Measure the current by putting the multimeter in series and parallel. Why are they different?

  • When measuring current in series a correct measurement of 41 mA was achieved.
  • When measuring in parallel the resistor was shorted and an incorrect value was measured for the current because when the resistor is shorted, it does not affect the current as it does when measured in series.

3.)Apply 5 V to two resistors (47Ωand 120Ω) that are in series. Compare the measured and calculated values of voltage and current values on each resistor.


Figure 3: The table above displays the calculated and measured current and voltage values for the two resistors in series.

4.)Apply 5 V to two resistors (47Ωand 120Ω) that are in parallel. Compare the measured and calculated values of voltage and current values on each resistor.

Figure 4: The table above displays the calculated and measured current and voltage values for the two resistors in parallel.

5.)Compare the calculated and measured values of the following current and voltage for the circuit below: (breadboard photo) 

a. Current on 2 kΩ resistor

  • Measured current for the 2k resistor was 1.6mA
  • Calculated current for the 2k resistor was 1.9mA

 b. Voltage across both 1.2 kΩ resistors.

  • Calculated Voltage for 1.2k (A) was 0.80 V.
  • Measured Voltage for 1.2k (A) was 0.80 V.
  • Calculated Voltage for 1.2k (B) was 0.74 V.
  • Measured Voltage for 1.2k (B) was 0.74 V.


Figure 5: Picture of our build of the circuit from Figure 7.


Figure 6: Different angle of the same circuit shown in Figure 7.
Figure 7: Picture of the circuits that were built above.


6.)What would be the equivalent resistance value of the circuit above (between the power supply nodes)?

Based on our calculations, the equivalent resistance value of the circuit above (Figures 5-7) is 2.5 kΩ.

7.)Measure the equivalent resistance with and without the 5 V power supply. Are they different? Why?

  • Without the power applied the meter reads 2.56 kΩ. A resistance is given because there is no voltage, in this case the 5V, to disrupt the DMM.
  • With the power applied the meter reads OL(Overload). OL occurs because there is voltage from both the DMM and the power supply which interfere with each other.

8.)Explain the operation of a potentiometer by measuring the resistance values between the terminals (there are 3 terminals, so there would be 3 combinations). (video)

Figure 8: In the video above, the operation of the potentiometer is explained.

9.)What would be the minimum and maximum voltage that can be obtained at V1 by changing the knob position of the 5 KΩ pot? Explain.

Figure 9: Pictured is the circuit relevant to the problem.
When the potentiometer is set to 0Ω there's no resistance so there will not be a voltage drop. If the potentiometer is set to something other than 0Ω the max voltage achieved will always be 5v.


10.)How are V1 and V2 (voltages are defined with respect to ground) related and how do they change with the position of the knob of the pot? (video)

Figure 10: Pictured is the circuit being demonstrated in the video.
Figure 11: In the video, the relationships between V1 and V2 are shown.

11.)For the circuit below, YOU SHOULD NOT turn down the potentiometer all the way down to reach 0 Ω. Why?

Figure 12: Pictured is the circuit relevant to the problem.
Because there's no resistance through the potentiometer all the current will flow through it causing it to overload and be damaged.

12.)How are current values of 1 kΩ resistor and 5 KΩ pot related and how do they change with the position of the knob of the pot? (video)

Figure 13: In the video the relationship between the 1K resistor and the potentiometer is displayed with respect to the position of the knob.

13.)Explain what a voltage divider is and how it works based on your experiments.

voltage divider is a simple circuit which turns a large voltage into a smaller one. Using just two series resistors and an input voltage, we can create an output voltage that is a fraction of the input. Using the potentiometer as a voltage divider we saw that the voltage varied between the two channels as the resistance changed.

14.). Explain what a current divider is and how it works based on your experiments.

A current divider can be used to calculate the current through any branch of a multiple-branch parallel circuit. Current divider refers to the splitting of current between the branches of the divider. In our experiment with the potentiometer in parallel with the resistor we saw that the current differed as the resistance changed.

Wednesday, January 18, 2017

Week 2

Wednesday

1.) What is the role of A/B switch?

The role of the A/B switch is to specify which supply is being displayed on the meter. If the switch is on A, B still gives voltage.

2.)  What do the current specifications for each channel mean?

The current specified are the max current allowed per channel. Up to 4A for the fixed 5V channel, and up to .5A for the A and B channels.

3.) Power supply modes: independent and tracking.

Independent mode is when the A/B switch is used to control the voltage of the outputs independently. 

Tracking mode has two different categories:

Series Tracking mode is when the the negative B terminal is connected to the positive A terminal, functioning in series to each other. One dial (A) can be used to control the output and the actual metered output is double the displayed voltage.

Parallel Tracking mode: A and B outputs function in parallel to each other. The B controls do not work, only A output terminal controls should be used. Current is doubled.

Figure 1: Shows the different modes of the power supply.

4.) Can you generate +30V?

By putting the power supply in series tracking mode, it is possible to achieve up to 48V, so by setting the output to 15V, the supply is actually giving 30V.

Figure 2: the +30V output using series tracking mode.

5.) Can you generate -30V?

Yes, by using the same method as #4, set in series tracking mode but with the polarity reversed will give a -30V instead of +30V.

Figure 3: the -30V output using series tracking mode.

6.) Can you generate +10V and -10V at the same time?

Yes, by setting the power supply to independent mode, 2 different simultaneous outputs can be achieved. To get -10V, the positive and negative leads of the DMM have to be connected to the opposite outputs of the circuit. For +10V the leads are connected traditionally.
Figure 4: Is the +10V output using independent mode.

Figure 5: Is the -10V output using independent mode and reversing the leads of the DMM.

7.) Apply 5V to a 100 Ω resistor and measure the current by using the DMM. Compare the reading with the current meter reading on the power supply. At what angle of the current knob makes the LED light on? If you keep on decreasing the current limit, what happens to the voltage and current? (Video)

Figure 6: shows the response of a 100ohm resistor to 5V

In the video, the current readings on the power supply and DMM are compared and are found to be very close. Then, the current dial is adjusted until the constant current light turned on which occured when the dial was between 8 and 9 o'clock. Lastly, it was shown that as the current dial is lowered, the voltage reading responds directly and decreases as well.

8.) Where is the fuse for the power supply? What is it for?

The fuse for the power supply is located on the rear panel. The purpose of the fuse is to prevent excessive current from damaging the device.

Figure 7: is the rear panel of a Triple Output DC Power Supply

9.) Where is the fuse for the DMM? What is it for?

The fuse for the power supply is located on the rear panel. The purpose of the fuse is to create an open circuit when the circuit is overloaded in order to prevent any damages to the DMM.

Figure 8: is the rear panel of the Digital MultiMeter


10.) What is the difference between 2W and 4W resistor measurements?

4W is more accurate for lower resistance testing because it cancels out wire resistance, 2W is less accurate for lower resistance because it doesn't cancel out wire resistance which in turn gives an improper reading.

11.) How would you measure current that is around 10 A using DMM?

To measure current that is around 10 A using the DMM plug positive lead into 12A max port. This should allow us to measure this current.

Friday, January 13, 2017

Week one

Week One

  • Monday  

1.) Class format: 


Monday: Discuss take home quiz (8:00-8:15),  Lab introduction (8:15-8:30), Lab (8:30-9:45), Wrap up (9:45-end)

Wednesday: Lab (8:00-9:45), Wrap up (9:45-end).

Friday: Possible Lab time, Blog commenting, Blog discussion.

Outside of Class: Take home quiz, comment on 2 blogs assigned, respond to comments on your blog and finish blog entries.


  • The class is out of 1000 points total. Each week 50 points is possible, composed of 30 points from a quiz and 20 points from a blog report. Additionally, 50 points per midterm (2) and 150 points for the final.

   2. ) Important Safety Rules:

  • Always work with a partner when using energized electrical equipment.
  • Always make sure all aspects of your workspace are dry.
  • Identify where safety equipment (first aid kid, fire extinguisher, phone, etc...) is.
  • Don't wear things on your hands that could prove to be hazardous.
  • When making measurements with probes, be sure one of your hands is placed behind your back.
  • Treat circuits with caution as they could be "hot". Also never touch 2 pieces of equipment simultaneously.
  • Always have an instructor inspect your circuit before applying power.

3.) Does Current Kill?  

Yes, current can kill you when it reaches a level of 100-200mA.

4.) How to read resistor color codes


5.) What is tolerance?

Tolerance is the range of acceptable values that a resistor may have. An example of tolerance occurred during lab when measuring resistor values vs. their displayed value. A resistor advertised as 180ohms ended up measuring 177.3ohms and with a tolerance level of +/- 5% or +/-9ohms was within the acceptable range. 

6.) Proof resistors are within range


All resistors are within range except for the 210 ohm resistor. This could be due to error that occurred during measurements or because of a flawed resistor. 

Wednesday

7.) Measuring voltage and current with the DMM

When measuring current with the DMM, you must break the loop and measure where the opening is to assure that the current doesn't remain in the circuit and avoid the DMM, preventing a measurement. On the contrary, when measuring voltage with the DMM, you preserve the loop and measure on both sides of the source. If you the loop is broke, there will be no current and as result, no voltage to measure.

8.) Different voltage values from a power source

Three different voltages can be supplied at one time by the power source. One is fixed at 5V and two are able to be changed independently anywhere from 0V-25V.

9.) Practice circuit results

Practice Circuit


Measuring Current and Voltage through the circuit


10.). How do you experimentally prove Ohm’s Law? Provide measurement results. Compare calculated and measured voltage, current, and resistance values. 

In order to successfully prove Ohm's Law, we applied five different voltages to two different resistors. The voltages and currents were put on a table, and utilizing Ohm's Law which states that R(Resistance)=V(Voltage)/I(Current), we were able to calculate the resistance of the two resistors. The results we acquired were pretty accurate, which proves that the Ohm's Law is accurate. 

Test 1: 53 Ohm Resistor
Test 2: 1000 Ohm Resistor

11.) Rube Goldberg Circuit

In the video below we can hear and observe how the motor runs. We can also hear it stop once we cover the photo resistor, proving we have a fully working circuit.


Friday

12.) Draw the circuit diagram for the Rube Goldberg set up.


13.) How can you implement this setup into a Rube Goldberg Machine

We could activate the photo resistor utilizing any type of light source. This would make the handle move forward utilizing a type of motor. The ping pong ball would land inside the cup making it move forward, therefore falling inside a bucket placed below it where the next Rube Goldberg circuit could be triggered