Wednesday, April 26, 2017
Monday, April 17, 2017
Week 13 group
6. Group task: Explain your group RG setup.
The RG for our group begins with joeys circuit being triggered by the previous group dropping some object on a force sensing resistor which triggers a transistor to send voltage to a relay which switches channels and also remains on that channel. once the relay switches it sends signal to an XOR gate which at this point has an input of 1-0. The XOR now sends voltage to the op amp and then the motor which pulls a cup which dumps marbles down the marble tower. once all the marbles reach the bottom they trigger another force sensing resistor which triggers a transistor that triggers a relay. the relay sends signal to the XOR gate which now has an input of 1-1. the XOR cuts voltage from the motor. Also the relay sends voltage to angels circuit. The voltage sent to angels circuit is amplified by an op amp which triggers a relay. from here the relay provides voltage to a motor which pulls a stopper from his ping pong tower and releases the ping pong ball to fall and be sent to the next group.
7. Group task: Video of a test run of your group RG.
Succesful combined attempt
Week 13 Joey
1. Provide the updated computer drawing for your individual RG setup.

2. Explain your setup.
The circuit starts with the force sensing resistor triggering a transistor to switch channels and using the diode the relay sends current to pin 2 from the pin it switched to in order to continue to flow after the transistor no longer sends any voltage. From here, voltage is sent to the X-OR gate where it is met by another input from the other very similar portion of the circuit. While the first relay sends a 1 to the x-or the x-or sends a signal to the op-amp that is then amplified and sent to the dc motor which pulls a lever on the built set-up pictured below that lets the marble run. Once the marble reaches the bottom it hits another force sensing resistor that triggers the second relay and sends a 1 to the x-or gate which then has inputs of 1/1 and then stops giving output to the motor. The transistor after the force sensing resistor can be used to trigger the second part of the RG setup.
3. Provide photos of the circuit and setup.
 |
| Marble tower, Physical component |
 |
| Picture of start |
 |
| Picture of XOR gate |
 |
| Complete picture of circuit |
4. Provide at least 2 new videos of your setup in action, one being a failed attempt.
Failure
Success
5. What failures did you have? How did you overcome them?
Failures this week occured connecting our circuits. in the video it is shown how after my circuit ends, angels doesnt start. this was happening because an issue with the op amp and the voltage my circuit provided it. The voltage my circuit was sending his would drop due to being wired up in series so the connection acted as a voltage divider. after fine tuning input levels we eventually found inputs that allowed it to work and as shown, we had success and my circuit triggered his after my mechanical aspect ended.
Sunday, April 16, 2017
Angel Week 13 Blog
1. Provide the updated computer drawing for your individual RG setup.

2. Explain your setup.
-The circuit begins with a 5V source connected to one end of a photocell and a ground source connected to the other pin of the photocell. The photocell is then connected to pin 3 of the Opamp. A ground source connected through a 3kOhm resistor is then connected to pin 2, this same source is also connected to pin 1 through a 3.9kOhm resistor. A voltage source of 5V is connected to pin 4 of the Opamp. Pin 1 of the Opamp which is the output is connected to pin 2 of the relay. A voltage source is connected to pin 1 of the relay and a ground source to pin 5. The DC motor is connected to pin 3 and and 7 segment display is connected to pin 4. The circuit begins with the 7 segment display turned on, since all the voltage going through the relay is coming out at pin 4. When a light source is applied to the photo sensor, it should switch the relay from pin 3 to pin 4 and make the DC motor go off, therefore starting the Rube Goldberg.
3. Provide photos of the circuit and setup.


4. Provide at least 2 new videos of your setup in action, one being a failed attempt.
-There were several problems I experienced while setting up my Rube Goldberg project. One of the biggest ones was making my circuit complicated enough. Although I did manage to implement all 5 necessary components into a small and not so complicated circuit, it was still too simple. I will fix it this upcoming week by modifying the input and output of my circuit coming from and going into the other Rube Goldberg projects. I will add more components in order to achieve a more complex circuit. One of the other failures was being able to come up with a mechanical part that could easily be adaptable to the following circuit, since it has to go from one side of the table to the other. I eliminated 4 different concepts before finally finding the perfect one.

2. Explain your setup.
-The circuit begins with a 5V source connected to one end of a photocell and a ground source connected to the other pin of the photocell. The photocell is then connected to pin 3 of the Opamp. A ground source connected through a 3kOhm resistor is then connected to pin 2, this same source is also connected to pin 1 through a 3.9kOhm resistor. A voltage source of 5V is connected to pin 4 of the Opamp. Pin 1 of the Opamp which is the output is connected to pin 2 of the relay. A voltage source is connected to pin 1 of the relay and a ground source to pin 5. The DC motor is connected to pin 3 and and 7 segment display is connected to pin 4. The circuit begins with the 7 segment display turned on, since all the voltage going through the relay is coming out at pin 4. When a light source is applied to the photo sensor, it should switch the relay from pin 3 to pin 4 and make the DC motor go off, therefore starting the Rube Goldberg.
3. Provide photos of the circuit and setup.

Photo of Circuit

Photo #1 of Setup

Photo #2 of Setup
Failed Attempt
Successful Attempt
5. What failures did you have? How did you overcome them?-There were several problems I experienced while setting up my Rube Goldberg project. One of the biggest ones was making my circuit complicated enough. Although I did manage to implement all 5 necessary components into a small and not so complicated circuit, it was still too simple. I will fix it this upcoming week by modifying the input and output of my circuit coming from and going into the other Rube Goldberg projects. I will add more components in order to achieve a more complex circuit. One of the other failures was being able to come up with a mechanical part that could easily be adaptable to the following circuit, since it has to go from one side of the table to the other. I eliminated 4 different concepts before finally finding the perfect one.
Tuesday, April 11, 2017
Angel's Week 12 Blog
1. Provide the computer drawing for your individual RG setup.

2. Explain your setup.
-The circuit begins with a 5V source connected to one end of a photocell and a ground source connected to the other pin of the photocell. The photocell is then connected to pin 3 of the Opamp. A ground source connected through a 3kOhm resistor is then connected to pin 2, this same source is also connected to pin 1 through a 3.9kOhm resistor. A voltage source of 5V is connected to pin 4 of the Opamp. Pin 1 of the Opamp which is the output is connected to pin 2 of the relay. A voltage source is connected to pin 1 of the relay and a ground source to pin 5. The DC motor is connected to pin 3 and an LED light is connected to pin 4. The circuit begins with the LED turned on, since all the voltage going through the relay is coming out at pin 4. When a light source is applied to the photocell, the voltage should drop below 2V which will switch it to pin 4 and make the DC motor go off, therefore starting the Rube Goldberg.
3. Provide photos of the circuit and setup.

Picture 1 of Circuit

Picture 1 of RG

Picture 2 of RG
4. Provide at least 2 videos of your setup in action (parts or whole), at least one being a failed attempt.
Rube Goldberg Fail
Rube Goldberg
5. What failures did you have? How did you overcome them?
-A big problem I encountered while making this circuit was being able to find the necessary voltage required to make the relay work. The photocell wasn't working properly at the beginning, but once it was replaced for a new one it started working perfectly. Another problem was utilizing the circuit to make the ball move in the mechanical part of the project. Since the ball started at such a high elevation, it was a struggle trying to make the ball move without knocking down the entire platform but after a while of moving everything and organizing it, I managed to make the project work.
Monday, April 3, 2017
Joey's Week 12 Blog
1. Provide the computer drawing for your individual RG setup.
 |
| Figure 1: Computer drawing of RG setup |
2. Explain your setup.
The circuit starts with the force sensing resistor triggering a transistor to switch channels and using the diode the relay sends current to pin 2 from the pin it switched to in order to continue to flow after the transistor no longer sends any voltage. From here, voltage is sent to the X-OR gate where it is met by another input from the other very similar portion of the circuit. While the first relay sends a 1 to the x-or the x-or sends a signal to the op-amp that is then amplified and sent to the dc motor which pulls a lever on the built set-up pictured below that lets the marble run. Once the marble reaches the bottom it hits another force sensing resistor that triggers the second relay and sends a 1 to the x-or gate which then has inputs of 1/1 and then stops giving output to the motor. The transistor after the force sensing resistor can be used to trigger the second part of the RG setup.
3. Provide photos of the circuit and setup.
 |
| Picture 1 of circuit |
 |
| Picture 2 of circuit (X-or gate) |
 |
| Picture 3 of circuit. This is where it starts. |
4. Provide at least 2 videos of your setup in action (parts or whole), at least one being a failed attempt.
Failed attempt
Succesful attempt
5. What failures did you have? How did you overcome them?
A lot of failures occurred this week. I had trouble and came to the conclusion i was using incompatible components because the X-OR gate could not reach a reading of 0-0 and then remain stable while going to 1-0. I think this was because I had the op-amp feeding into the x-or gate and the inputs of the logic gate were drawing voltage from the op-amp even when it was supposed to be given 0. After removing the op-amp and getting a new x-or it worked as planned. the op amp was placed after the x-or to give the motor enough power. the other issues faced were regarding the structural integrity of the cardboard coaster. after reinforcing with some duct tape it worked much better.
Monday, March 27, 2017
Week 11
Part A: Strain Gauges:


Part C: Energy Harvesters
1. Connect the oscilloscope probes to the strain gauge. Record the peak voltage values (positive and negative) by flipping/tapping the gauge with low and high pressure. Make sure to set the oscilloscope horizontal and vertical scales appropriately so you can read the values. DO NOT USE the measure tool of the oscilloscope. Adjust your oscilloscope so you can read the values from the screen. Fill out Table 1 and provide photos of the oscilloscope.

Flip Strength Data Table

Press Strength Data Table
2. Press the “Single” button below the Autoscale button on the oscilloscope. This mode will allow you to capture a single change at the output. Adjust your time and amplitude scales so you have the best resolution for your signal when you flip/tap your strain gauge. Provide a photo of the oscilloscope graph.
 |
| strain gauge oscilloscope graph |
 |
| Graph for button |
Part B: Half Wave Rectifiers:
1. Construct the following half-wave rectifier. Measure the input and the output using the oscilloscope and provide a snapshot of the outputs.
 |
| picture of circuit |
 |
| output and input signals for half-wave rectifier |
2. Calculate the effective voltage of the input and output and compare the values with the measured ones by completing the following table.
 |
| calculated and measured values of half wave rectifier for input and output. |
3. Explain how you calculated the rms values. Do calculated and measured values match?
- For Input the rms values were calculated by dividing the peak to peak value on the function generator by the square root of 2. For output we divide the peak to peak in half then the resultant value by the square root of 2.
4. Construct the following circuit and record the output voltage using both DMM and the oscilloscope.
 |
| picture of circuit construction |
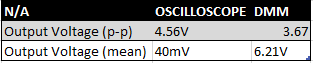 |
| output voltage at capacitor |
5. Replace the 1 µF capacitor with 100 µF and repeat the previous step. What has changed?
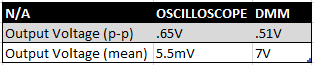 |
| output voltage with different capacitor. |
Part C: Energy Harvesters
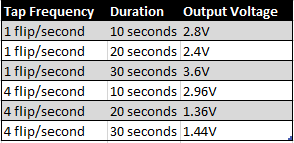
1. Construct the half-wave rectifier circuit without the resistor but with the 1 µF capacitor. Instead of the function generator, use the strain gauge. Discharge the capacitor every time you start a new measurement. Flip/tap your strain gauge and observe the output voltage. Fill out the table below:
 |
| Output voltages for strain gauge, half wave rectifier. |
2. Briefly explain your results.
- The data we acquired from this test was not as accurate as it could've been. We expected the voltage to increase with the amount of time and flips, but due to inconsistency in the flipping we ended up with values that don't exactly follow a constant pace.
3. If we do not use the diode in the circuit (i.e. using only strain gauge to charge the capacitor), what would you observe at the output? Why?
- The output would be doubled because the diode only allows half the signal to be transmitted.
4. Write a MATLAB code to plot the date in table of Part C1.
 |
| Matlab graph for outputs. |
Monday, March 20, 2017
Week 10
PART A: MATLAB practice.
1. Open MATLAB. Open the editor and copy paste the following code. Name your code as FirstCode.m
Save the resulting plot as a JPEG image and put it here.
 |
| Figure 1: Graph of code given |
2. What does clear all do?
The clear all command clears the command terminal.
3. What does close all do?
The close all command clears the workspace of all figures and the command terminal for a brand new workspace.
4. In the command line, type x and press enter. This is a matrix. How many rows and columns are there in the matrix?
1 row, 5 columns.
5. Why is there a semicolon at the end of the line of x and y?
The semicolon is used to end a command.
6. Remove the dot on the y = 2.^x; line and execute the code again. What does the error message mean?
The error code means that in order to use the power (^) function, the object being taken to a power must be of a scalar value. The dot is used to signify a number as a scalar.
7. How does the LineWidth affect the plot? Explain.
Line width affects the plot
8. Type help plot on the command line and study the options for plot command. Provide how you would change the line for plot command to obtain the following figure (Hint: Like ‘LineWidth’, there is another property called ‘MarkerSize’)
 |
| Example graph to replicate. |
 |
| Our graph |
10. Provide the code for the following figure. You need to figure out the function for y. Notice there are grids on the plot.
>> clear all;
close all;
x = [1 2 3 4 5];
y = 2.^x;
plot(x, y,':ks', 'LineWidth', 6, 'MarkerSize', 18);
grid
xlabel('Numbers', 'FontSize', 12)
ylabel('Results', 'FontSize', 12)
 |
| Picture of graph represented by code above |
11. Degree vs. radian in MATLAB:
a. Calculate sinus of 30 degrees using a calculator or internet.
Sin(30 Degrees) = .5
b. Type sin(30) in the command line of the MATLAB. Why is this number different? (Hint: MATLAB treats angles as radians).
Sin(30) = -0.9880 This is the value when calculations are being done in radians rather than degrees.
c. How can you modify sin(30) so we get the correct number?
by typing sind(30), this makes the function calculate in degrees rather than radians.
12. Plot y = 10 sin (100 t) using Matlab with two different resolutions on the same plot: 10 points per period and 1000 points per period. The plot needs to show only two periods. Commands you might need to use are linspace, plot, hold on, legend, xlabel, and ylabel. Provide your code and resulting figure. The output figure should look like the following:
>> clear all;
close all;
t = linspace(0,0.126,10);
y = 10*(sin(100*t));
x = linspace(0,0.126,1000);
z = 10*(sin(100*x));
plot(t, y, '-ro',x, z, 'k' )
axis([0 .14 -10 10]);
xlabel('Time(S)')
ylabel('y function');
legend('Coarse', 'Fine');
 |
| Example |
 |
| Our version |
13. Explain what is changed in the following plot comparing to the previous one.
Every value of Z that was found to be greater than 5 was changed to 5.
14. The command find was used to create this code. Study the use of find (help find) and try to replicate the plot above. Provide your code.
>> clear all;
close all;
t = linspace(0,0.126,10);
y = 10*(sin(100*t));
x = linspace(0,0.126,1000);
z = 10*(sin(100*x));
f = find(z>5);
z(f) = 5;
plot(t, y, '-ro',x, z, 'k' )
axis([0 .14 -10 10]);
xlabel('Time(S)')
ylabel('y function');
legend('Coarse', 'Fine');
 |
| Our graph using find function |
PART B: Filters and MATLAB
1. Build a low pass filter using a resistor and capacitor in which the cut off frequency is 1 kHz. Observe the output signal using the oscilloscope. Collect several data points particularly around the cut off frequency. Provide your data in a table.
 |
| Low pass filter table |
2. Plot your data using MATLAB. Make sure to use proper labels for the plot and make your plot line and fonts readable. Provide your code and the plot.
 |
| Low pass filter graph |
>> clear all;
close all;
x = [0 .1 .2 .3 .4 .5 .6 .7 .8 .9 1 1.1 1.2 1.3 1.4];
y = [3.7 3.68 3.6 3.5 3.38 3.26 3.12 2.98 2.85 2.85 2.72 2.6 2.47 2.37 2.26];
plot(x, y)
xlabel('Frequency(KHz)', 'FontSize', 12)
ylabel('Vout(rms)', 'FontSize', 12)
>>
3. Calculate the cut off frequency using MATLAB. find command will be used. Provide your code.
Cutoff frequency between 1.1 and 1.4 Khz
clear all;
close all;
x = [0 .1 .2 .3 .4 .5 .6 .7 .8 .9 1 1.1 1.2 1.3 1.4];
y = [0 3.7 3.68 3.6 3.5 3.38 3.26 3.12 2.98 2.85 2.72 2.6 2.47 2.37 2.26];
z = [0 1.05 1.04 1.02 .99 .96 .92 .88 .84 .81 .77 .74 .69 .67 .64];
plot(x, z, )
s = find(z == 0.70)
x(s)
4. Put a horizontal dashed line on the previous plot that passes through the cutoff frequency.
 |
| Low pass filter graph with cut off frequency shown |
clear all;
close all;
x = [0 .1 .2 .3 .4 .5 .6 .7 .8 .9 1 1.1 1.2 1.3 1.4];
y = [3.7 3.68 3.6 3.5 3.38 3.26 3.12 2.98 2.85 2.85 2.72 2.6 2.47 2.37 2.26];
z = [0 1.05 1.04 1.02 .99 .96 .92 .88 .84 .81 .77 .74 .69 .67 .64];
plot(x, z)
xlabel('Frequency(KHz)', 'FontSize', 12)
ylabel('Vout(rms)', 'FontSize', 12)
hold on;
x = [0 .1 .2 .3 .4 .5 .6 .7 .8 .9 1 1.1 1.2 1.3 1.4];
z = .707
plot(x,z,'k+', 'LineWidth', 6)
xlabel('Frequency (kHz)', 'Fontsize', 12)
ylabel('Vout/Vin (V)', 'FontSize', 12)
hold off;
High Pass Filter (1-4)
1.
 |
| High pass filter table |
clear all;
close all;
x = [0 .1 .2 .3 .4 .5 .6 .7 .8 .9 1 1.1 1.2 1.3 1.4];
y = [0 .5 .7 1.05 1.35 1.63 1.86 1.97 2.03 2.11 2.14 2.16 2.17 2.17 2.18];
z = [0 .14 .19 .29 .37 .46 .52 .55 .57 .59 .6 .61 .61 .61 .62];
plot(x, z)
xlabel('Frequency(KHz)', 'FontSize', 12)
ylabel('Vout(rms)', 'FontSize', 12)
hold on;
x = [0 .1 .2 .3 .4 .5 .6 .7 .8 .9 1 1.1 1.2 1.3 1.4];
z = .4
plot(x,z,'k+', 'LineWidth', 6)
xlabel('Frequency (kHz)', 'Fontsize', 12)
ylabel('Vout/Vin (V)', 'FontSize', 12)
hold off;
 |
| High pass filter graph with cutoff frequency shown |
Monday, March 13, 2017
week 9
1. Measure the resistance of the speaker. Compare this value with the value you would find online.
4. Build the following circuit. Add a resistor in series to the speaker to have an equivalent resistance of 100 Ω. Note that this circuit is a high pass filter. Set the amplitude of the input signal to 8 V. Change the frequency from low to high to observe the speaker sound. You should
- The speaker has a resistance of 9ohm
2. Build the following circuit using a function generator setting the amplitude to 5V (0V offset). What happens when you change the frequency? (video)
Figure 1: Video showing speaker function.
 |
| Figure 2:Table displaying speaker functions at different frequencies. |
3. Add one resistor to the circuit in series with the speaker (first 47 Ω, then 820 Ω). Measure the voltage across the speaker. Briefly explain your observations.
Fill the following table. Discuss your results.
| Figure 3: Table showing differences with different resistors. |
4. Build the following circuit. Add a resistor in series to the speaker to have an equivalent resistance of 100 Ω. Note that this circuit is a high pass filter. Set the amplitude of the input signal to 8 V. Change the frequency from low to high to observe the speaker sound. You should
not hear anything at the beginning and start hearing the sound after a certain frequency. Use 22 nF for the capacitor.
a. Explain the operation. (video)
Figure 4: Video showing high pass filter.
b. Fill out the following table by adding enough (10-15 data points) frequency measurements. Vout is measured with the DMM, thus it will be rms value.
 |
| Figure 5: Table displaying values for high pass filter. |
c. Draw Vout/Vin with respect to frequency using Excel.
 |
| Figure 6: Graph of high pass filter Vout/Vin vs. Frequency |
d. What is the cut off frequency by looking at the plot in b?
- The cutoff frequency occurs when the Vout/Vin ratio is 1/2 of the max Vout. In our case this occurred between 8 and 10 KHz.
e. Draw Vout/Vin with respect to frequency using MATLAB. Your code would look like this;
 |
| Figure 7: Vout/Vin vs Frequency graph using MATLAB |
f. Calculate the cut off frequency theoretically and compare with one that was found in c.
- The max theoretical cutoff frequency gives us a value of 9KHz. We got this value by taking half the max of Vout and finding when Vout/Vin is equal to it. The one we found in part c was between 8 and 10KHz, which is close to the theoretical value.
g. Explain how the circuit works as a high pass filter.
- Its a high pass filter because it allows high frequency signals and cuts off low frequency signals. This happens as a result of the capacitor's inductance being dependent on frequencies and its relationship when in series. The capacitor has high resistance to low frequencies and low resistance to high frequencies.
5. Design the circuit in 4 to act as a low pass filter and show its operation. Where would you put the speaker? Repeat 4a-g using the new designed circuit.
- The speaker is in parallel to the capacitor rather than in series.
a. Explain the operation. (video)
Figure 8: Video explaining low pass filter.
b. Fill out the following table by adding enough (10-15 data points) frequency measurements. Vout is measured with the DMM, thus it will be rms value.
 |
| Figure 9: Table displaying low pass filter values. |
c. Draw Vout/Vin with respect to frequency using Excel.
 |
| Figure 10: Graph of low pass filter Vout/Vin vs Frequency. |
d. What is the cut off frequency by looking at the plot in b?
- The cutoff frequency is 8KHz.
6. Construct the following circuit and test the speaker with headsets. Connect the amplifier output directly to the headphone jack (without the potentiometer). Load is the headphone jack in the schematic. “Speculate” the operation of the circuit with a video.
The video above explains the operation.
Sunday, March 12, 2017
Draw and explain a Rube Goldberg design that will include the following components:
* Digital
* Motor
* Relay
* Opamp
* Temperature sensor
* LED
- The circuit we prepared contains three different steps in order to make it work effectively. We used a temperature sensor in order to send an output. We realized the output sent by the temperature sensor was not high enough to activate the relay, so in order to make it work the temperature sensor was connected to a non-inverting opamp. This gave us a gain of 6 which is high enough for the relay to be activated. This same output was sent to our LED and Digital in order to let us know when the relay was activated. Once we successfully triggered the relay a voltage of 6 volts was sent straight to our DC motor.
- Our Rube Goldberg consisted of a DC motor attached to a device similar to a crane. The DC motor is attached to a cup with a marble inside by a string which is consistently pulled up until it reaches a desired angle. Once it reaches that angle the ball falls through an opening in the cup making it go down the ramp and achieving the desired purpose.
Video of our Rube Goldberg with explanation:
Figure 1: video displaying how the rube goldberg circuit works.
 |
| Figure 2: Picture of the circuit before the relay switches. |
 |
| Figure 3: Picture of the circuit after the relay is switched. |
 |
| Figure 4: Drawing of circuit. |
- We had issues with time constraints which prevented us from having our digital display showing something other than the number 7, which is our group number. We had issues with time because our original circuit had a broken relay and 555 timer that took up a majority of the time on our first day, we then had to start over on wednesday which set us back. The only problem we faced after starting over again was the temperature sensor wasn't giving an output until we replaced it and the op-amp wasn't the correct one corresponding to the relay.
Subscribe to:
Posts (Atom)