1. You will use the OPAMP in “open-loop” configuration in this part, where input signals will be applied directly to the pins 2 and 3.
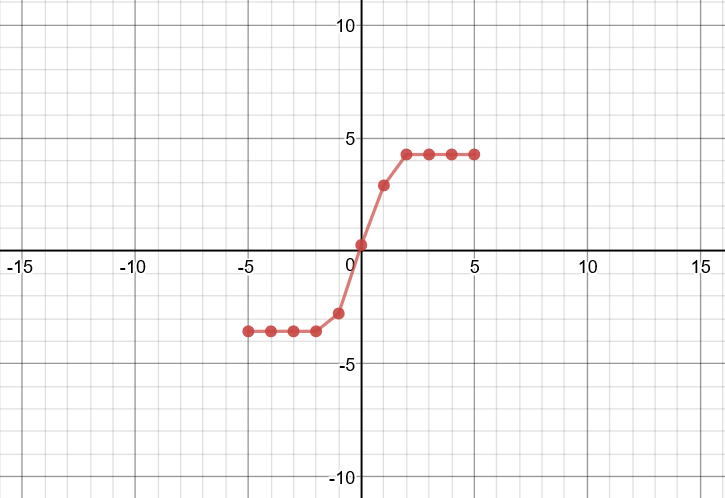
a. Apply 0 V to the inverting input. Sweep the non-inverting input (Vin) from -5 V to 5 V with 1 V steps. Take more steps around 0 V (both positive and negative). Create a table for Vin and Vout. Plot the data (Vout vs Vin). Discuss your results. What would be the ideal plot?
Figure 1: Table displaying Vin vs. Vout for non-inverting amplifier.
The graph shows the change in values for Vout.
Due to the amplifier being non inverting, the Vout was the same sign as Vin. The output was also amplified as shown until reaching a certain Vin where a max Vout is reached and it becomes constant (-4.2 and 4.52). The ideal plot would be 0 output at 0 and then the exact measurement for gain.
b. Apply 0 V to the non-inverting input. Sweep the inverting input (Vin) from -5 V to 5 V with 1 V steps. Take more steps around 0 V (both positive and negative). Create a table for Vin and Vout. Plot the data (Vout vs Vin). Discuss your results. What would be the ideal plot?
Figure 2: Table displaying Vin vs. Vout for inverting amplifier.
The graph shows the change in values for Vout.
As expected, due to the amplifier being inverting the Vout values were the opposite sign as Vin. The output was also amplified just as the non-inverting was, once it reached a max Vout, the amplification became constant at (4.52 and -4.2). The ideal plot would be 0 output at 0 and then the exact measurement for gain.
2. Create a non-inverting amplifier. (R2 = 2 kΩ, R1 = 1 kΩ). Sweep Vin from -5 V to 5 V with 1 V steps. Create a table for Vin and Vout. Plot the measured and calculated data together.
Figure 3: Table displaying Vin vs. Vout for the non-inverting amplifier.
Graph Vout for the non-inverting amplifier
For the non inverting amplifier the gain was 3. This can be seen when Vin is 1V but then Vout reaches its max at (4.27 or -3.56).
3. Create an inverting amplifier. (Rf = 2 kΩ, Rin = 1 kΩ). Sweep Vin from -5 V to 5 V with 1 V steps. Create
a table for Vin and Vout. Plot the measured and calculated data together.
Figure 4: Table displaying Vin vs. Vout for inverting amplifier.
Graph for Vout.
For the inverting amplifier the gain was 2 as shown when Vin is 1V. After this, Vout reaches its max at (4.21 or -3.5).
4. Explain how an OPAMP works. How come is the gain of the OPAMP in the open loop configuration
too high but inverting/non-inverting amplifier configurations provide such a small gain?
An OPAMP takes an input signal and amplifies it and can also invert the polarity of the signal if the OPAMP is set in inverting configuration. However, the output signal can not be higher than the values put into V+ and V-. When the OPAMP is in open loop configuration there are no resistors to implement a low enough gain and therefore the gain is very high and often reaches higher than V+ or V- very easily.
TEMPERATURE CONTROLLED LED SYSTEM
1. Connect your DC power supply to pin 2 and ground pin 5. Set your power supply to 0V. Switch
your multimeter to measure the resistance mode; use your multimeter to measure the
resistance between pin 4 and pin 1. Do the same measurement between pin 3 and pin 1. Explain
your findings (EXPLAIN)
Between pin 4 and pin 1 we measured a resistance of 2 Ohms. And the resistance between pin 3 and 1 gave us an overload because pin 3 wasn't connected to the circuit due to Vin being less than Vthreshold.
2. Now sweep your DC power supply from 0V to 8V and back to 0V. What do you observe at the
multimeter (resistance measurements similar to #1)? Did you hear a clicking sound? How many
times? What is the “threshold voltage values” that cause the “switching?” (EXPLAIN with a
VIDEO)
Figure 5: Video explaining the circuit.
3. How does the relay work? Apply a separate DC voltage of 5 V to pin 1. Check the voltage value
of pin 3 and pin 4 (each with respect to ground) while switching the relay (EXPLAIN with a
VIDEO).
Figure 6: Video explaining how a relay works.
LED RELAY
1. Connect positive end of the LED diode to the pin 3 of the relay and negative end to a 100 ohm
resistor. Ground the other end of the resistor. Negative end of the diode will be the shorter
wire.
2. Apply 3 V to pin 1
3. Turn LED on/off by switching the relay. Explain your results in the video. Draw the circuit
schematic (VIDEO)
Figure 7: Picture representation of the circuit.
Figure 8: Video showing how the relay circuit works.
OPERATIONAL AMPLIFIER
1. Connect the power supplies to the op-amp (+10V and 0V). Show the operation of LM 124
operational amplifier in DC mode with a non-inverting amplifier configuration. Choose any
opamp in the IC. Method: Use several R1 and R2 configurations and change your input voltage
(voltages between 0 and 10V) and record your output voltage. (EXPLAIN with a TABLE)
In your last OPAMP tables with different resistor configurations. I noticed your Vout peak amplitude changed a fair amount. In our experiment our peak Vout amplitude was about the same no matter the resistor configuration. I am curious as what would cause that?
I never noticed that till now. Im not really sure what could have caused that, it might have been an inconsistency while measuring. Thanks for the feedback!
Make sure to upload your graphs! I found it really interesting as I am going through each of these blogs that we are all receiving close to the same values for nearly every test we ran. Did you have an issue with any of the set ups? It took us a few minutes to figure out the operational amplifier, but once we did it was pretty easy to do.
Thanks for reminding us to upload the graphs. Also the only issues we had was when implementing the LED, our light was broken and it took us a while to realize that it was the light not the circuit. Thanks for the feedback!
For Question 1 (last 1), we had the same resistors however our R1 was the 47 and our R2 was the 100 but we ended up getting alot fewer unique readings than you did, our maximum values were still the same but only had 4 numbers that differed from the maximum
Your tables at the top were done well and the text for them are really well writen you should do all your captions like them. They still need graphs though. Also in you tables you should follow the same number formatting so if you have 3 sig figs you should stick to using 3 or less and not go above 3.
I think your blog is set up nicely, but on the graphs for the non inverting amplifier if you made measurements closer to zero it would be a more accurate graph. We made the same mistake unfortunately but everything else still looks really nice.
I really like your blog, it is easy to read and the color of the tables is nice. your videos were well explained but I think you could use some more text explanation. For Q3, your measurement value were almost the same as our values but the graph is different because you didn't plot the calculated output voltages. I also like your explanation for question 4.
The blog looks great the videos are well done, but the circuit schematic for the LED relay is a little hard to see may want to try and draw it a little darker. Also question 2 and 3 ask for calculated values too.
We had different results for number 1, but I think this is because we got confused and switched our graphs and tables. If that is the case, then I agree with you. Why do you think every group gets slightly different results when they are supposed to have the same conditions? Does the 0L on a multimeter stand for overload or 0 load? You did a good job at keeping the videos short and to the point. Overall, I think the blog looks good.
Nice explanations of your graphs, also, your data matches our own hinting at the biasing for non-inverting and inverting op-amps. I am surprised however you were able to get more than 2 different outputs for your 1a and 1b circuits.
I tried to compare our calculations to yours, I found them mostly similar but I noticed that: Q1 a and b, in our calculation the maximum had little difference then the minimum bot in your bloge was the same value with different sign. Im Q2 and Q3, I think you missed to write and plot the calculated part. Otherwise everything was good Good job
For questions with a table and plot, try putting them next to each other for easier comparisons. Definitely need some white space towards the end of your blog post. You forgot to put calculations for #2 and #3, I know this lab report was rough because we were missing components but you're missing quite a few questions that could have been answered.
For questions with a table and plot, try putting them next to each other for easier comparisons. Definitely need some white space towards the end of your blog post. You forgot to put calculations for #2 and #3, I know this lab report was rough because we were missing components but you're missing quite a few questions that could have been answered.
I like the blue font and the white background. It would be easier to read your tables if they were all next to each other instead of having to scroll to see them all. Your data looks very close to my groups data so nice work!
Well done! Very few qualms except that maybe the x axis could be shrunk on your graphs so as to understand the graph better. Also, you may want to add calculated values on your earlier problems.
I have just one comment, and it is a small correction of a typo in your blog. For question 3, the caption under the graph states the gain is 2, where it should be -2. An inverting amp does not and cannot have a positive gain.
For a and b in question 1 I think it is important to somewhat force your experimental values to fit your theoretical values due to the sensitivity of the op amp if you can set the voltage supply to true zero you should receive a very minimal output voltage at the zero value and therefore your graphs wont be shifted horizontally.


In your last OPAMP tables with different resistor configurations. I noticed your Vout peak amplitude changed a fair amount. In our experiment our peak Vout amplitude was about the same no matter the resistor configuration. I am curious as what would cause that?
ReplyDeleteI never noticed that till now. Im not really sure what could have caused that, it might have been an inconsistency while measuring. Thanks for the feedback!
Deletei think for both a and b in question #1 we got almost the same values so that's might be correct for me but think you only need to upload the graphs
ReplyDeleteThanks for reminding us to add the graphs, i didn't realize it was needed. Thanks for the feedback!
DeleteMake sure to upload your graphs! I found it really interesting as I am going through each of these blogs that we are all receiving close to the same values for nearly every test we ran. Did you have an issue with any of the set ups? It took us a few minutes to figure out the operational amplifier, but once we did it was pretty easy to do.
ReplyDeleteThanks for reminding us to upload the graphs. Also the only issues we had was when implementing the LED, our light was broken and it took us a while to realize that it was the light not the circuit. Thanks for the feedback!
DeleteDon't forget to add Graphs for your tables! The information as it currently is looks good though.
ReplyDeleteThanks for the reminder for the graphs!
DeleteFor Question 1 (last 1), we had the same resistors however our R1 was the 47 and our R2 was the 100 but we ended up getting alot fewer unique readings than you did, our maximum values were still the same but only had 4 numbers that differed from the maximum
ReplyDeleteThats interesting that you had more consistent readings, it might have been something we did differently. Thank you for the feedback
DeleteYour tables at the top were done well and the text for them are really well writen you should do all your captions like them. They still need graphs though. Also in you tables you should follow the same number formatting so if you have 3 sig figs you should stick to using 3 or less and not go above 3.
ReplyDeleteThats a good point about the sig figs, that would add a lot of aesthetic. Thank you for the feedback!
DeleteI think your blog is set up nicely, but on the graphs for the non inverting amplifier if you made measurements closer to zero it would be a more accurate graph. We made the same mistake unfortunately but everything else still looks really nice.
ReplyDeleteI really like your blog, it is easy to read and the color of the tables is nice. your videos were well explained but I think you could use some more text explanation. For Q3, your measurement value were almost the same as our values but the graph is different because you didn't plot the calculated output voltages. I also like your explanation for question 4.
ReplyDeleteThe blog looks great the videos are well done, but the circuit schematic for the LED relay is a little hard to see may want to try and draw it a little darker. Also question 2 and 3 ask for calculated values too.
ReplyDeleteWe had different results for number 1, but I think this is because we got confused and switched our graphs and tables. If that is the case, then I agree with you. Why do you think every group gets slightly different results when they are supposed to have the same conditions? Does the 0L on a multimeter stand for overload or 0 load? You did a good job at keeping the videos short and to the point. Overall, I think the blog looks good.
ReplyDeleteNice explanations of your graphs, also, your data matches our own hinting at the biasing for non-inverting and inverting op-amps. I am surprised however you were able to get more than 2 different outputs for your 1a and 1b circuits.
ReplyDeleteI tried to compare our calculations to yours, I found them mostly similar but I noticed that:
ReplyDeleteQ1 a and b, in our calculation the maximum had little difference then the minimum bot in your bloge was the same value with different sign.
Im Q2 and Q3, I think you missed to write and plot the calculated part. Otherwise everything was good
Good job
For questions with a table and plot, try putting them next to each other for easier comparisons. Definitely need some white space towards the end of your blog post. You forgot to put calculations for #2 and #3, I know this lab report was rough because we were missing components but you're missing quite a few questions that could have been answered.
ReplyDeleteFor questions with a table and plot, try putting them next to each other for easier comparisons. Definitely need some white space towards the end of your blog post. You forgot to put calculations for #2 and #3, I know this lab report was rough because we were missing components but you're missing quite a few questions that could have been answered.
ReplyDeleteI like the blue font and the white background. It would be easier to read your tables if they were all next to each other instead of having to scroll to see them all. Your data looks very close to my groups data so nice work!
ReplyDeleteWell done! Very few qualms except that maybe the x axis could be shrunk on your graphs so as to understand the graph better. Also, you may want to add calculated values on your earlier problems.
ReplyDeleteI have just one comment, and it is a small correction of a typo in your blog. For question 3, the caption under the graph states the gain is 2, where it should be -2. An inverting amp does not and cannot have a positive gain.
ReplyDeleteGood blog. Limited responses to comments.
ReplyDeleteFor a and b in question 1 I think it is important to somewhat force your experimental values to fit your theoretical values due to the sensitivity of the op amp if you can set the voltage supply to true zero you should receive a very minimal output voltage at the zero value and therefore your graphs wont be shifted horizontally.
ReplyDelete